User Images
Statistics: Cineca users
You can see on this page the images created by our users on Cineca supercomputers. Click on the image to enlarge!
I. Girotto1,2,3, K.P.N. Datadien2, G. Di Staso2 and F. Toschi2
1.The Abdus Salam International Centre for Theoretical Physics
2.Eindhoven University of Technology
3.University of Modena and Reggio Emilia
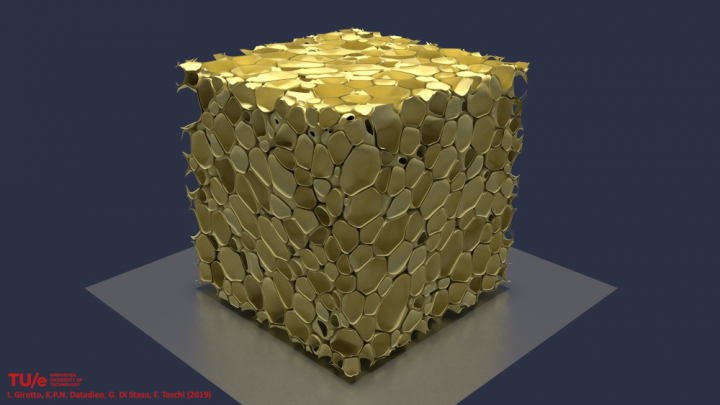
“TurEmu – The physics of (turbulent) emulsions”
High-resolution 3d visualisation of a stabilised emulsion with ~75% volume fraction for the dispersed droplet phase in a 5123 lattice produced via turbulent stirring. A complex interfaces structure is clearly visible with non-spherical droplets.
View the video!
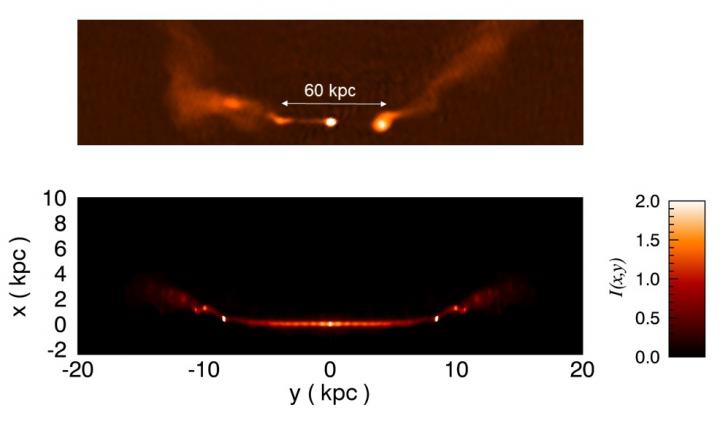
Silvano Massaglia, Gianluigi Bodo, Sandro Capetti, Paola Rossi, Andrea Mignone
Department of Physics, University of Turin
“Jet/ambient interaction in low-power radiosources”
Top: radio image at 4.6 GHz of 3C 465, from the NRAO VLA Archive Survey (counter clockwise by 145) showing the typical morphology of Wide Angle Tail sources. The resolution is 400 and the field of view is 20 70, corresponding to 70 250 kpc.
Bottom: 3D MHD simulations of low power AGN jets, cut in the (y; z) plane of the (smoothed) brightness distribution in arbitrary units at the evolution time t=5 10^7 years
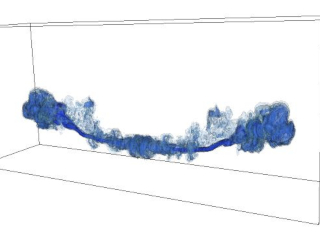
Silvano Massaglia, Gianluigi Bodo, Sandro Capetti, Paola Rossi, Andrea Mignone
Department of Physics, University of Turin
“Jet/ambient interaction in low-power radiosources”
3D MHD simulations of low power AGN jets, 3D iso-contours of the tracer distribution for the WAT source
Salvatore Colombo
INAF
We investigated the effects of an intense coronal activity on the disk of a classical T Tauri Star. We modeled a magnetized protostar surrounded by an accretion disk through 3D magnetohydrodinamic simulations.
Riccardo Valdarnini
SISSA
2D images extracted from simulations of driven subsonic turbulence.
These were performed using a standard Lagrangian SPH code (left) and an improved scheme based on an integral approach (right).
From top to bottom: density (top), velocity (middle) and curl of the velocity (bottom). From Valdarnini (2016, ApJ, 831, 103).
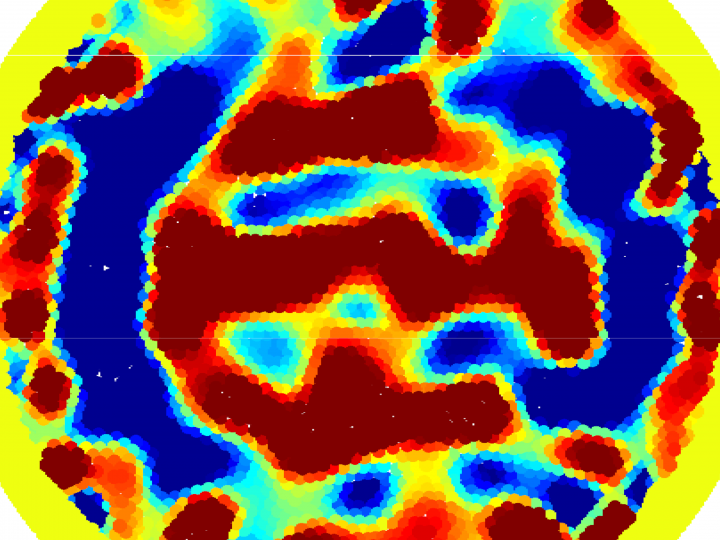
Luca Zanni
University Modena & Reggio Emilia
High-Performance Computing for Brain Tomographic Microwave Imaging
Microwave tomography inspection reveals changes in the brain tissues and thereby enables to detect and identify the type of stroke. From left to right: cross-section of brain with ischemic stroke, healthy brain and brain with hemorrhagic stroke.
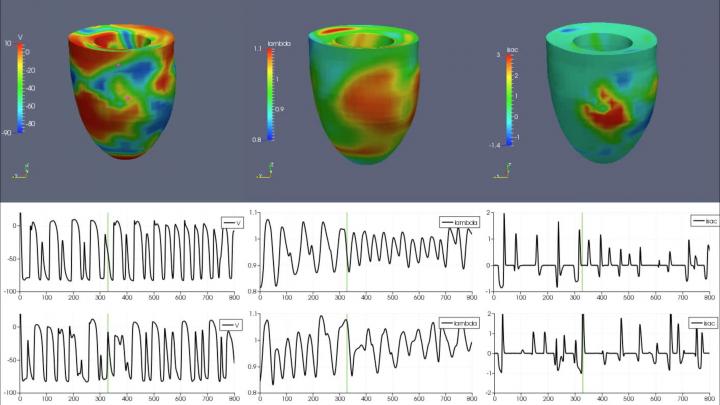
Piero Colli Franzone, Luca F Pavarino, Simone Scacchi
University of Pavia
Computational Cardiology
Simulation results over 4000 msec of a irregular cardiac beat.
Top: distribution of the transmembrane potential v, stretch Lambda, stretch-activated current I_sac at 330 msec. (green bar in the waveforms below).
Bottom: waveforms of v, lambda, I_sac at two epicardial points (two pink dots in the v distribution plot above).
From Chaos 27 (9), 2017
Johannes Martens, Laura Schreiber
Comprehensive Heart Failure Center, University Hospital Wuerzburg
In order to enable Computational Fluid Dynamics simulations of blood flow and particle transport in the scope of contrast agent bolus-based Magnetic Resonance Imaging of cardiac perfusion, scaling tests were performed on the FERMI cluster at CINECA.
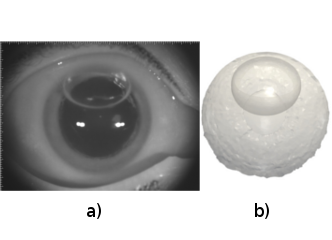
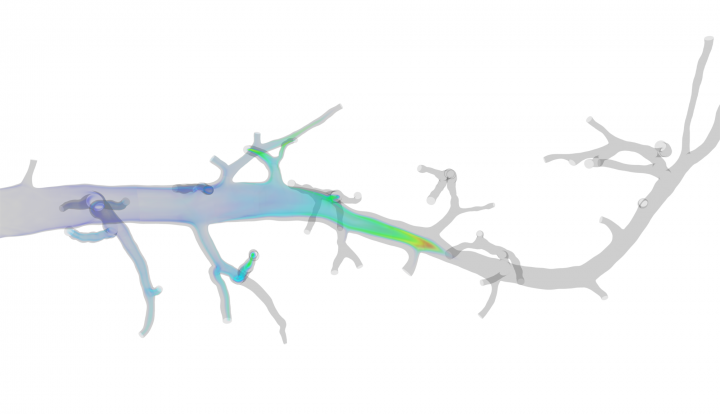
Jan Oscar Pralits
University of Genoa, Italy
The influence of positioning and anterior chamber shape on gas bubble coverage on grafts after DMEK (Descemets Membrane Endothelial Keratoplasty): a numerical and clinical study
a) Slit-lamp imaging of 37% volume air fill in the anterior chamber of a human eye showing the air bubble shape;
b) three-dimensional reconstruct from the numerical result using VoF in OpenFOAM of a patient specific geometry obtained from OCT images. Gravity acts from top to bottom.
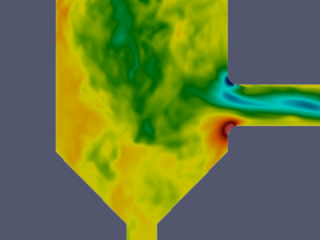
Jan Oscar Pralits, Marco Atzori, Matteo Colli
University of Genoa, Italy
SpraySim and SprayVal
Vertical velocity component in symmetry plane. Simulations performed using OpenFOAM, Wallresolved LES.
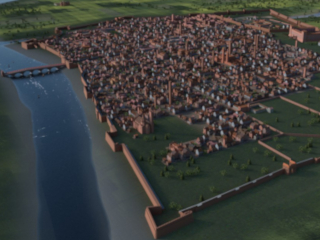
Alessandra Setti
University of Pavia, Italy
Virtual Reconstruction of Pavia in the 16th century by Computer Vision students of Pavia University and CVLM staff.
About 100 3D models of buildings and a whole host of characters milling through the city’s streets in videos implemented on CINECA HPC
Alfredo Soldati, Alessio Roccon
University of Udine, Italy
Project VISTRATU
Turbulence structures in a viscosity stratified turbulent channel flow, at the top wall, turbulence is largely modulated while, by opposite, at the bottom wall a strong turbulence activity is found.
Results are obtained from Direct Numerical Simulation (DNS) of turbulence coupled with a Phase Field Method (PFM) to describe the interfacial phenomena.
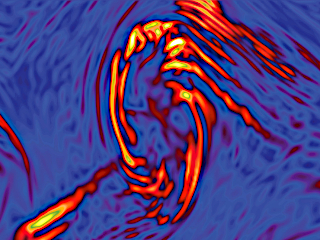
Dario Borgogno, Anna Perona and Daniela Grasso
Test-electron analysis of the magnetic reconnection topology, Phys of Plasmas 24, 122303 (2017)
Contour plot on a constant z-plane of the current density at a late nonlinear, chaotic stage of a three-dimensional simulation of a collisionless magnetic reconnection process.
F. Bonelli, Annarita Viggiano and V. Magi
School of Engineering, University of Basilicata, Italy
Large Eddy Simulation of Highly Turbulent Compressible Gas
Jets Influence of Mach and Reynolds Numbers on the Fluid Dynamic Characteristics of Turbulent Jets
LES of gas jets with Reynolds number equal to 10000: vorticity contour plots for different Mach numbers. The vorticity intensity decreases along the edge of the potential core with increasing Mach, thus causing an increase of the core length.
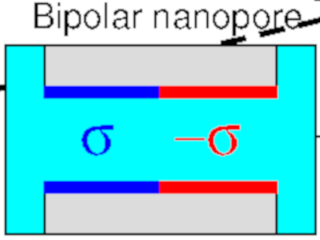
Dezso Boda and Simone Furini
University of Pannonia, Hungary and University of Siena, Italy
Simulation of ion transport through nanopores with Brownian dynamics
In a multiscale modeling framework, collaborating parties with complementary skills simulate ion transport through ion channels and nanopores using models (from all-atom to goarse-grained) studied by computational techniques fitting model resolution.
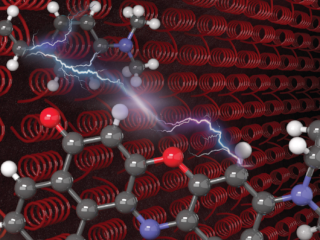
Francesco Di Maiolo, Anna Painelli
Intermolecular Energy Transfer in Real Time DOI
The real-time dynamics of the Resonance Energy Transfer (RET) between two organic chromophores is calculated in a model where each dye is described in terms of two electronic states coupled to a single vibrational quantum coordinate and RET is driven by electrostatic intermolecular interactions. The nonadiabatic dissipative dynamics of the RET pair coupled to a Redfield bath describes the weak coupling (Fӧrster) RET, occurring from the vibrationally relaxed energy donor, as well as the strong coupling RET, occurring from vibrationally hot states.
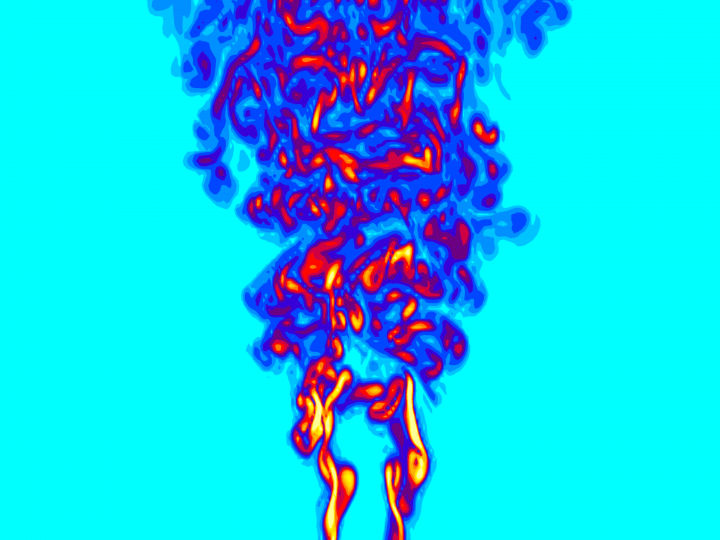
Francesco Valentini, Adriana Settino
Kelvin-Helmholtz vortices in the Earth’s magnetosphere, observed in a multi-dimensional kinetic simulation.
Different plasma regions mix, leading to the generation of fully developed turbulence
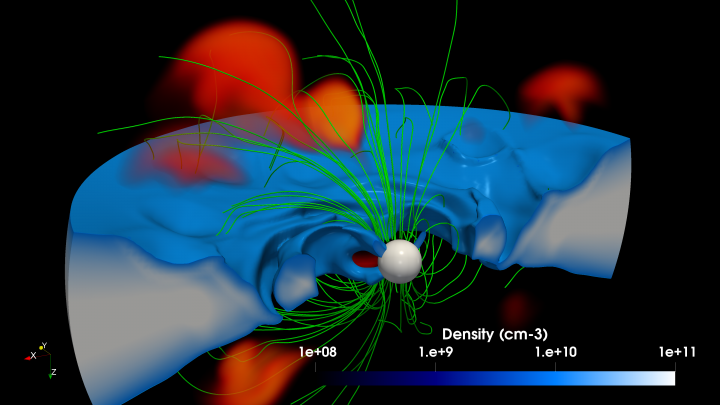
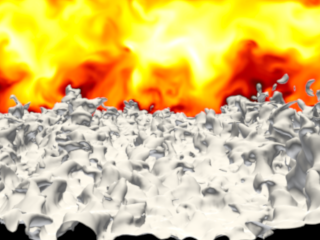
Nitin Shukla
First three-dimensional kinetic simulation of the laser-driven Biermann battery effect.
The picture illustrates the interaction between an intense laser pulse (light orange) and an ionized plasma target (blue surface), generating a strong toroidal magnetic field (dark orange), via the Bierman battery mechanism. Indeed, as a consequence of the interaction, the expansion of the plasma occurs in a direction perpendicular to the electron heating, thus giving rise to a non-zero ∇ n x ∇ T and, hence, a magnetic field. The blue arrows represent the electron current, showing the so-called fountain effect.
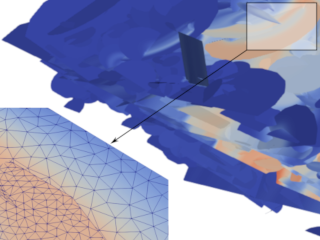
Stefano Berrone
Science Domain: Computational Engineering
Numerical simulation of the dispersion phenomena of a pollutant in a system of fractures using advanced computational tools on non conforming meshes with optimal parallel speedups on distributed memory architectures