User Statistics
- /
- Our Activities
- /
- Services
- /
- Service Statistics
- /
- User Statistics
USERS STATISTICS 2022-2023
Active Users per year
On our HPC infrastructure, the active users at the end of 2022 are 4450, 155 more than the year before, confirming the positive trend of the last four years.
Institution Classification
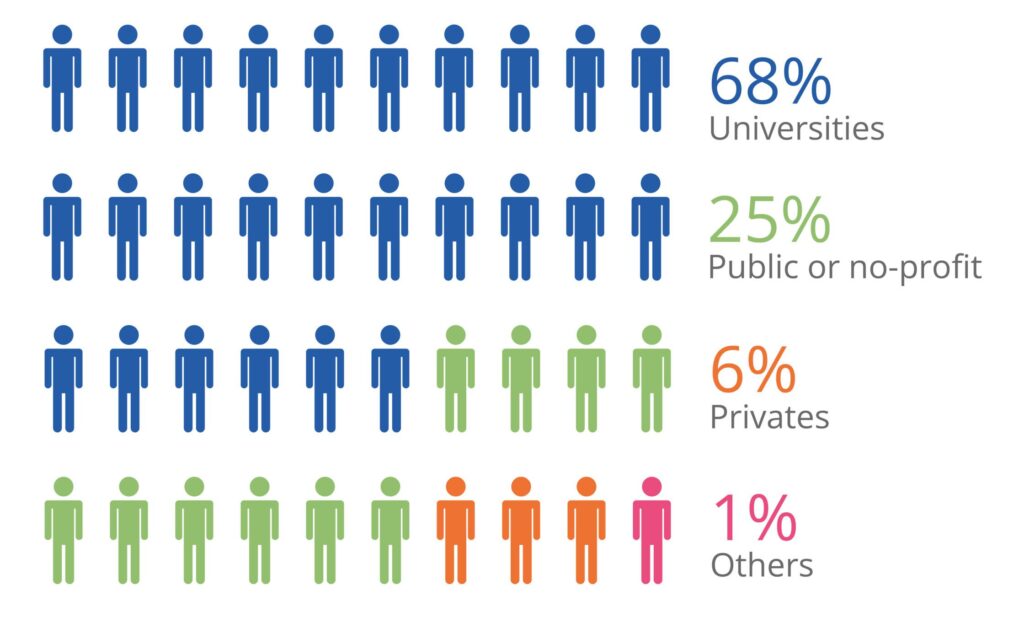
Without taking in consideration nationality, 68% of users (48% Italian, 20% international) work or study for a University, a Polytechnic, or a School of Advanced Studies, 25% work for a public or no-profit institution, including nationals research centers and other public research institutions (9+5% Italian, 8% International, plus 3% internal users), while 6% are private institution users (5% Italian, 1% international).

Scientific domains
Scientists use Cineca computational resources within all scientific disciplines. The most represented three are Computational Chemistry, Condensed Matter Physics and Computational Fluid Dynamics, with about11% each, followed by Nuclear Fusion (10%), Computational Engineering, Astrophysics, and Plasma Physics with more than 9% each.
Geographic distribution of institutions
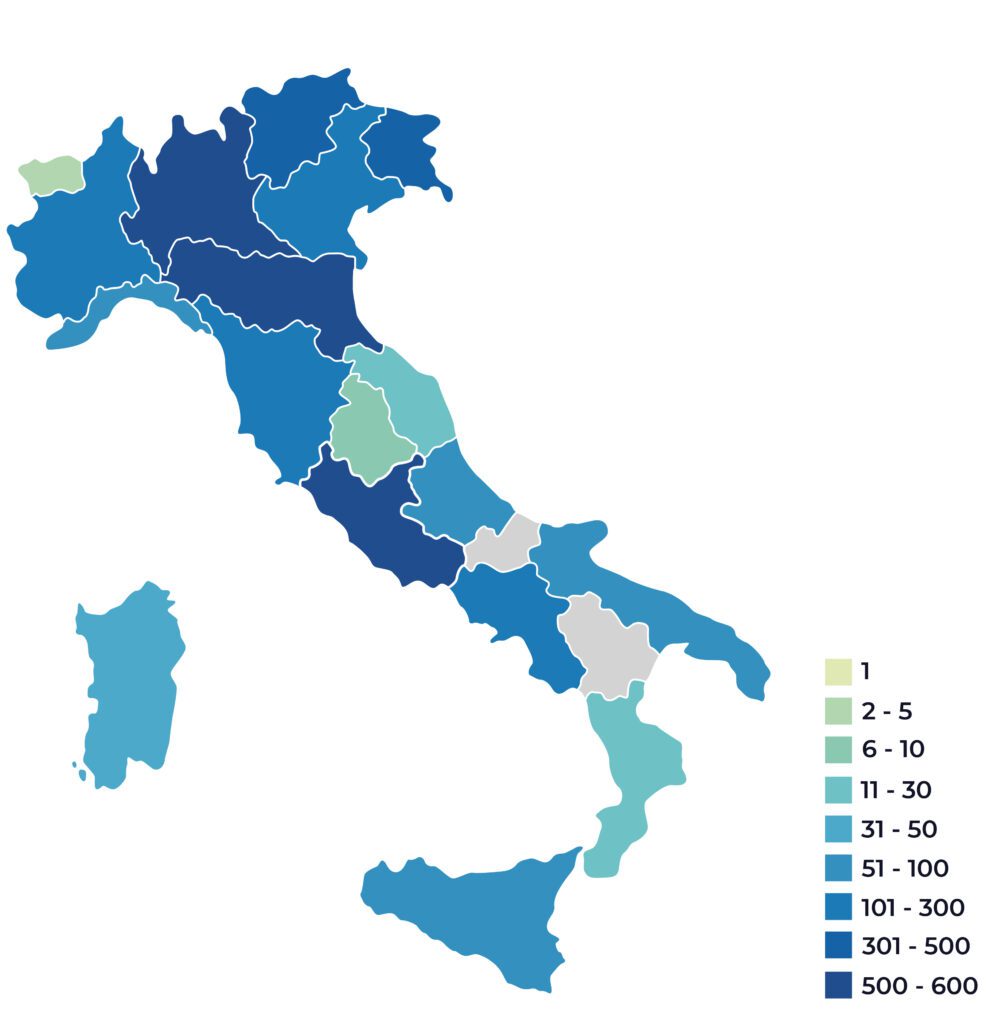
67% of the total number of users work for an Italian institution, clustered in the Emilia Romagna region (19%), Lombardia region (18%), and Lazio (16%). While going to city level, Milan, Rome, Bologna and Trieste, in the order, have a user’s percentage going from 15% to 11%.
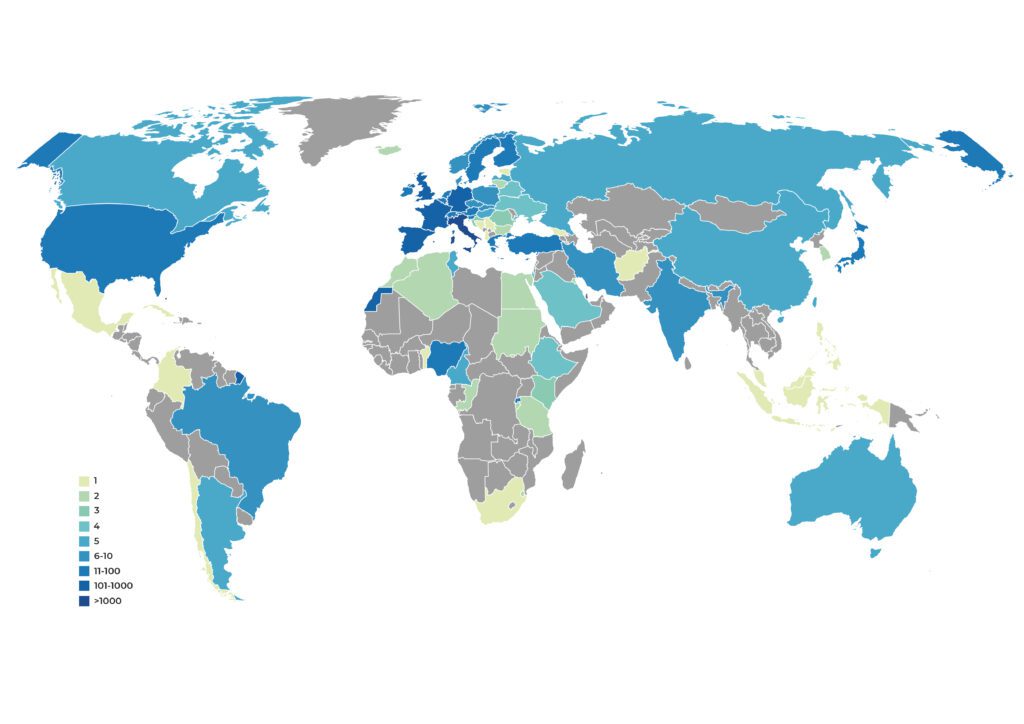
On the international side, the higher concentration of users is in Europe: the more represented foreign countries are Germany with 5% and the United Kingdom, France and Spain with 3% each, mainly working for universities and public or non-profit organizations.

